Gaining Valuable Insights From Complex Surveys with Alchemer
Posted 3 years ago by Milos Svana

Surveys are a great way to collect opinions from a large number of people from different groups, subsequently using this information to design better products and services. Despite the proliferation of many advanced analysis tools it’s often difficult to understand the needs of your customers without the direct communication provided by surveys.
Simple survey tools such as Google Forms work well in most situations. But as our colleagues at the Technical University of Ostrava have discovered, there are use cases that require more advanced features. Researchers at the university have proposed a new robust survey analysis method addressing two common problems: uncertainty of the survey responses given and the need to aggregate opinions from different stakeholder groups. While the method itself is robust, it is also time-consuming and hard to manage with common survey tools.
Implementing this new method in Google Forms or Microsoft Forms is not very convenient and the resulting survey experience is not great for the respondents either. Then we discovered Alchemer – an online survey platform with many advanced features that made creating and analyzing complex surveys with uncertainty and multiple stakeholders much easier.
As noted above, the research group at the university set out to solve two problems that occur frequently when collecting opinions using surveys.
The first problem is that respondents are often uncertain about their answers. They might, for example, lack important information about a given topic. The new method addresses this by combining each question with a question about the respondent’s hesitance – “How confident are you in your answer?” To limit the scope, the researchers focused on questions where respondents can express their opinion on a Likert scale by choosing a response ranging from “Strongly disagree” to “Strongly agree”.
Basically, the respondent has to choose two answers for each question – their opinion and the degree of confidence in that opinion. Here is an example:
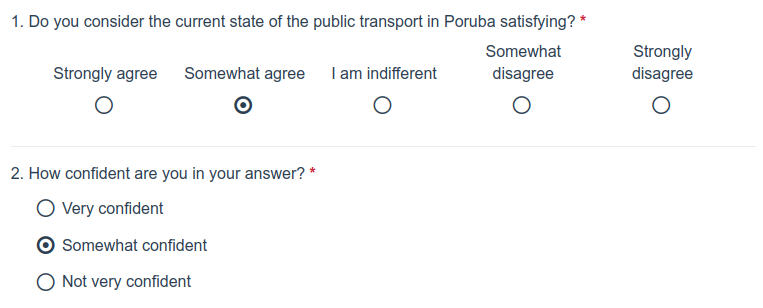
At the first glance, there are no obvious difficulties in adding these two questions in tools such as Google Forms. But there is one logical condition complicating everything. The confidence part of the question should be displayed only if the respondent selects an answer different from “I am indifferent”, indicating that the person is not interested in the topic or simply doesn’t want to answer.
The second issue is the need to distinguish between multiple stakeholder groups when collecting opinions. The researchers demonstrated this in a survey about a new tram line proposal in profiq’s home city of Ostrava. When considering urban projects of this scale, multiple stakeholder groups should be involved – people living in a given district, people commuting there, local businesses, ecological activists, or urban architects.
Having a single survey design with the same questions for all groups is not conducive to yielding accurate and comparable results. Each group provides a different perspective on the issue. Although some questions might be shared, in general it is helpful to design different question sets for each group. In a simple survey tool, we would need to create multiple surveys. This means more work and issues during response processing.
How Alchemer helps
If you have created an online survey in the past, you will find much of what Alchemer offers is very familiar. Your survey is generally split into multiple pages, each containing one or multiple questions of many different types. In Alchemer, you can also add more unique elements to each page. These include paragraphs or images clarifying the questions, or so-called hidden fields and actions which, as we will see later, help us implement more advanced behavior.
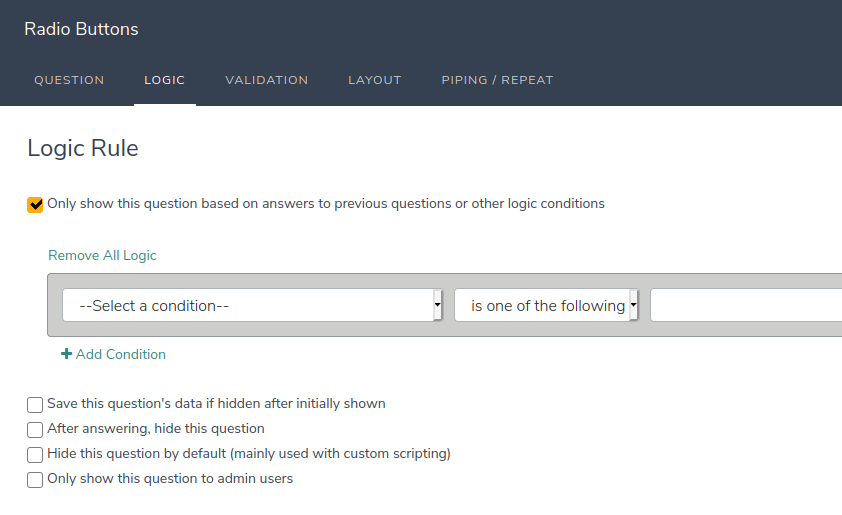
When defining a question, Alchemer offers a Logic editor with a plethora of options to modify the branching of your survey so everyone goes down different paths depending upon how they answer a certain question. Using the Logic editor, we can easily define a condition making our confidence question visible only if the respondent chooses something other than “I am indifferent” in the corresponding opinion question:
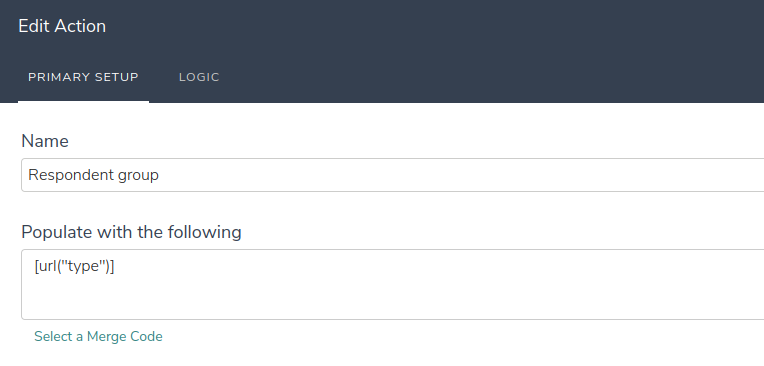
The Logic editor also lets us solve the issue of displaying different questions to different stakeholder groups. Before we can define an appropriate logic rule, we need to first identify the stakeholder group of each respondent. To do this, we can add a hidden field that can store a value for further processing without showing it to the respondent. One type of storable value is a GET parameter contained in the survey URL. In our case, we define a hidden field whose value is determined by the type GET parameter:
After the hidden field is defined, we can use its value to define display logic for specific questions or pages. We can easily say that the respondent should see a question only if the hidden field assumes a specific value:
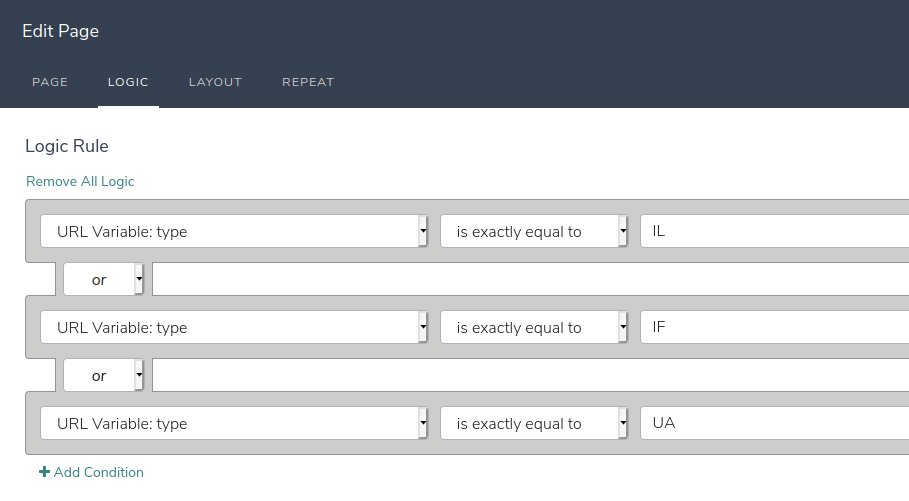
Using hidden fields and advanced logic offered by Alchemer, we were able to fully implement the survey on the new tram line as designed by the researchers. In total, this survey contains 15 Likert scale questions further split into an opinion question and a confidence question. We consider 5 respondent groups which, as we just described, are identified using the type parameter in the URL:
- IL – People living in the Poruba district,
- IF – People regularly commuting to Poruba,
- MA – Managers of local business,
- EN – Environmental activists,
- UA – Urban architects.
Complex surveys require more complex mathematics
Survey design is only a small part of the proposed method. Its key contribution is in processing the response data and presenting the results. The researchers propose a 3-level aggregation approach.
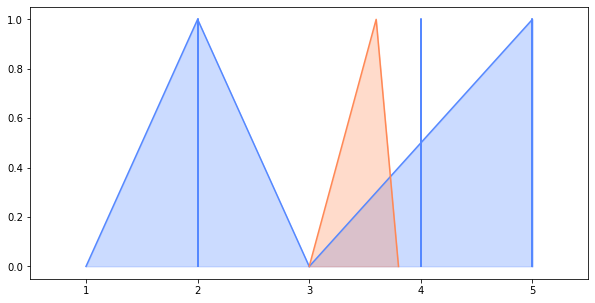
At the first level, answers from each respondent are considered individually. Using a relatively simple process, the opinion on each question and the corresponding level of confidence are used to construct a fuzzy set that is able to store both parts of the information at the same time. Fuzzy sets differ from normal “crisp” sets that most of you know from your mathematics classes in the ability to assign a degree of membership to each element of a set. They allow us to say that a certain element belongs to a set only partially. The degree of membership usually takes a value between 0 (not being in a set at all) and 1 (full membership). In our case, the fuzzy representation of each answer takes the form of a triangle. The opinion part determines the position of the top vertex with membership degree set to 1 and the level of confidence then tells us how wide the triangle should be. Low confidence means a wider triangle – the answer is “more fuzzy”:
After each answer is “fuzzified”, we can calculate the arithmetic mean of fuzzy sets representing individual answers. The result is – again – a triangular fuzzy set that represents the overall opinion and level of confidence of one respondent. For this to work, we also need to properly orient each question. Low/high value on the Likert scale always has to imply the same opinion on the overall topic of the survey. In our case, low value always indicates negative perception of the new tram line.
At the second level, we use the average answer of each respondent in a given group to understand the opinion of that group as a whole. Without diving deep into the mathematics behind the method, the researchers suggest calculating the degree of truth of the statement “most people in this group have positive (or negative) opinion on the new tram line”. This is done using fuzzy logic. Analogously to fuzzy sets, fuzzy logic extends the classical logic by not only letting us say that something is true or false, but also allowing us to determine a degree to which some statement is true.
We can interpret the degree of truth as the amount of positive or negative opinion in a group. This reflects the real world quite well. We are often aware of both advantages and disadvantages of a certain phenomenon at the same time. If it occurs, we can’t say that our opinion is clearly positive or clearly negative. Fuzzy logic allows us to capture this information.
At the third and final level, we can calculate the overall consensus among different groups. The researchers propose to use quite a complex aggregation process called the Choquet integral. Skipping the mathematics, the Choquet integral considers coalitions of different groups. We can create 32 different coalitions from the 5 groups defined in our tram line problem. This also includes a coalition of all 5 groups, single group coalitions, as well as an empty coalition. To apply the Choquet integral, we need to determine the importance of each coalition and express it as a number between 0 and 1. The full coalition of all 5 groups has ‘importance’ always set to 1 while the empty coalition has ‘no importance’. When assigning ‘importance’, we chose to strongly prefer coalitions that contain the group of people living in the Poruba district, where the considered tram line would be built.
After we determine the importance of each coalition, the Choquet integral can be used to calculate the consensus on the amount of positive and negative opinion. The result of this step is similar to the previous level – we get the total amount of positive and negative opinion, when considering all respondent groups together.
How Alchemer helps
You can imagine that implementing everything we just described using simple survey tools would be quite difficult. Outside of displaying some basic charts, analytical features on most simple survey tools are often very limited. To do something more complex, you have to download the raw data and process it yourself using statistical software or custom scripts created in R and Python.
Using Alchemer, you still may have to use custom scripts for your analysis, however, the process is far more painless than without. Alchemer allows you to use R and JavaScript to process and subsequently present the survey results in virtually any way you want. All R and JavaScript scripts can be managed by selecting Research library -> R scripts from the Alchemer menu.
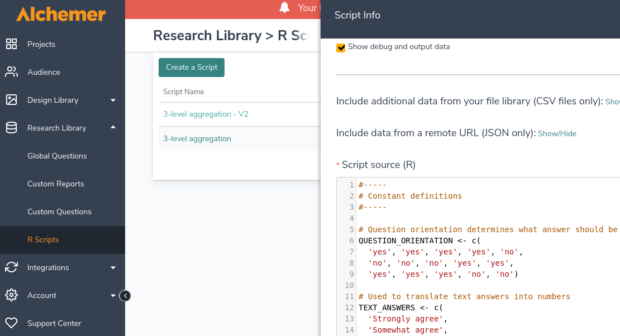
We took advantage of this integration and created an R script that implements the whole 3-level aggregation process. Alchemer provides a few additional functions that allow you to load the survey data into the R environment. We chose to use the most basic approach and load everything at once as an R data frame using the sgGetAllData() function. After that, we could use all the standard R functions to perform the aggregation.
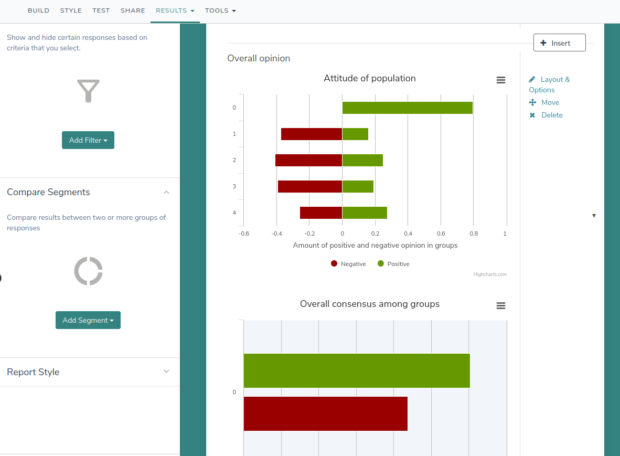
In Alchemer, R is not the tool of choice when it comes to displaying the results to the user. After data is analyzed, the sgAddChart() function can be used to send all required information to the JavaScript part of the script. To access data sent from R from JavaScript, we can call the SG.getData() function. Thanks to the integration with the HighCharts library, you can then display the results graphically in almost any way you want.
You can include your R and JavaScript scripts into dynamic reports that Alchemer lets you create for each survey. These reports are highly customizable and, most importantly, they are not just some boring PDFs you download and send to your colleagues; they’re dynamic web pages that reflect the most recent responses. Here is a simple example of how the last 2 levels of the aggregation process can be presented to the user:
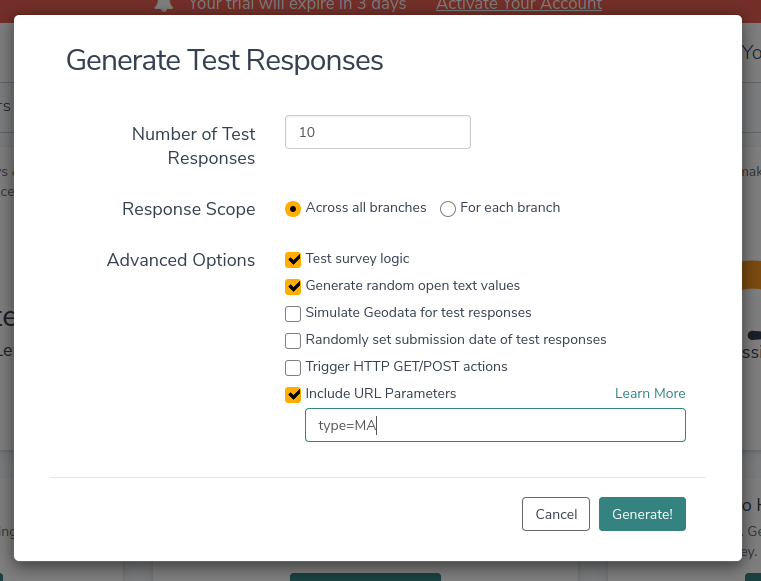
Finally, Alchemer allowed us to test the script and results visualization without the need of talking to actual respondents or creating fake answers manually. They offer an intuitive tool to generate a set of random responses. This is an ideal approach when it comes to debugging your scripts and graphics. The tool even lets you fake the GET parameters needed to distinguish between multiple stakeholder groups.
Alchemer: Our impressions and conclusion
Alchemer is a great tool for creating advanced surveys. We demonstrated some of Alchemer’s capabilities in an extreme case by implementing a survey analysis method that was only recently developed by university researchers. The number of features Alchemer offers to its users is impressive; we were able to show you only a very small subset.
As a side note we need to mention that many of these advantages do not come for free. Some features like R scripting are available only in the highest subscription tier. But if your business depends on gathering and processing complex customer data, the investment is probably worth it. Even the university is currently considering purchasing an Alchemer subscription to evaluate how students and teachers perceived the educational process during the Covid-19 pandemic.
During our experiments with Alchemer, we also encountered a few issues. We discovered several bugs in the UI, but none of them were crucial or deal-breaking. Alchemer also uses an older version of the HighCharts library, and not everything works as is described in HighCharts’ official documentation. It’s important to mention that we did most of our work in January and February of 2021. We assume that Alchemer developers will fix the problems we found in the near future, making the experience of creating advanced surveys even better.